

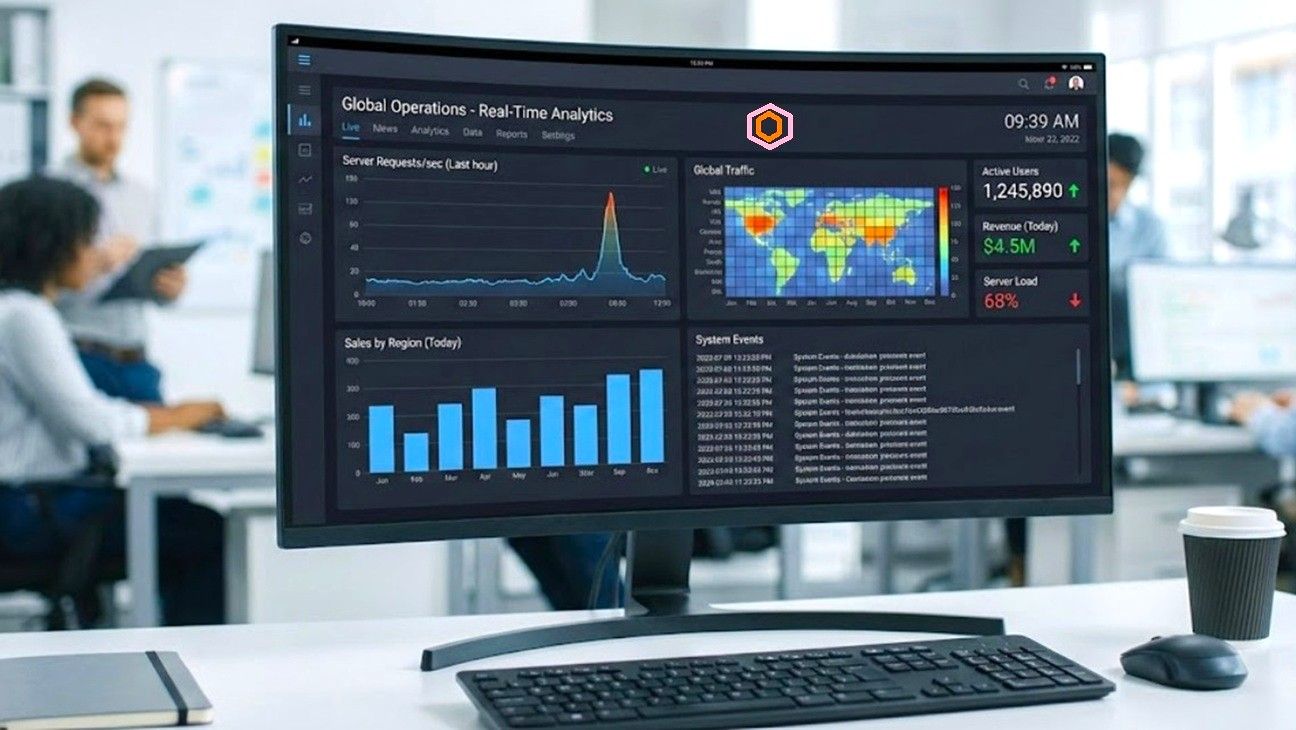
Real-Time Insights
Monitoring stream: production_cluster_01
Active Users
1,284
↑ 12%
vs last hour
Conversion Rate
3.42%
↓ 0.4%
vs last hour
Server Load
42%
Avg. Response Time
118ms
Optimized
Node Cluster A
Traffic Volume Stream
Events per second (EPS)
LIVE
Device Distribution
Mobile
58%
Desktop
32%
Tablet
10%
Live Event Log
Auto-refreshing…| Event ID | Timestamp | Action | Origin | Status |
|---|
1 thought on “Real-time data analytics dashboard: Visual Architecture”
Heard about lucky6868live through a friend and I gotta say, I’m hooked. Live action is always a good time. You might like what they offer we got from tecxskill.com learning skill with depth