
1. Microsoft Excel: The Powerhouse
Excel is crucial for skill development. It is the most important tool for for “skilling up.” Mastering Excel, especially dynamic formulas for complex data management, is essential for skill development and for working efficiently, productively, and on time.
Important Rule
Always Audit your formulas using the “Trace Precedents” feature (Ctrl + [) to ensure you aren’t calculating from empty or wrong cells.
Essential Advanced Formulas
=XLOOKUP(A2, D:D, E:E)=INDEX(C:C, MATCH(A2, B:B, 0))=SUMIFS(Sales, Region, "North", Month, "Jan")=IFERROR(Formula, "N/A")=TEXTJOIN(", ", TRUE, A2:A10)Advanced Skill: Pivot Tables & Slicers
Don’t just list data; summarize it.
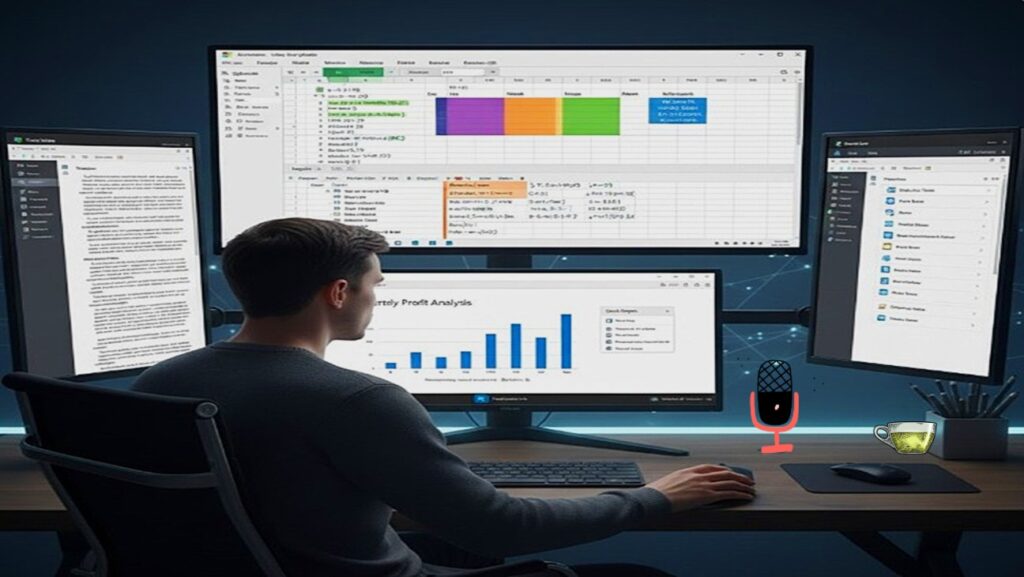
The Goal: Take 10,000 rows of sales data and instantly see “Total Profit per Category per Quarter.”
Pro Tip: Use Slicers (visual filters) to create an interactive dashboard that updates when you click a button.
How to Do: Interactive Dashboards
- Clean Data: Ensure no empty rows or columns in your data range.
- Insert Pivot: Select your data > Insert > PivotTable.
- Map Fields: Drag “Date” to Rows, “Category” to Columns, and “Sales” to Values.
- Add Visuals: Go to PivotTable Analyze > Insert Slicer > Select “Region”. Now, clicking a region filters the whole table instantly.
Dynamic Array Power
Leverage FILTER and SORT formulas to build live-updating lists without manual sorting or filtering.
=FILTER(A2:B10, B2:B10 > 100)
Data Validation Secrets
Create Dependent Drop-down Lists where the second list changes based on what you picked in the first one.
Certification Challenge
Practical Project to Skill Up
To truly advance, build a “Professional Business Report” from scratch using the ecosystem.
Phase: Excel Data
Create a sales tracker using SUMIFS and a Pivot Table.
Phase: Word Report
Create a 5-page summary report using Styles and an Automatic Table of Contents.
Phase: PPT Summary
Summarize the findings in 5 slides using Linked Charts from your Excel file.
Modern Microsoft Office : Cloud & AI
Real-Time Co-Authoring
Stop emailing versions. Use AutoSave and Version History to track who changed what in real-time on OneDrive.
Copilot Integration
Learn to Prompt Office to generate draft decks, summarize long email threads, and write complex Excel formulas using natural language.