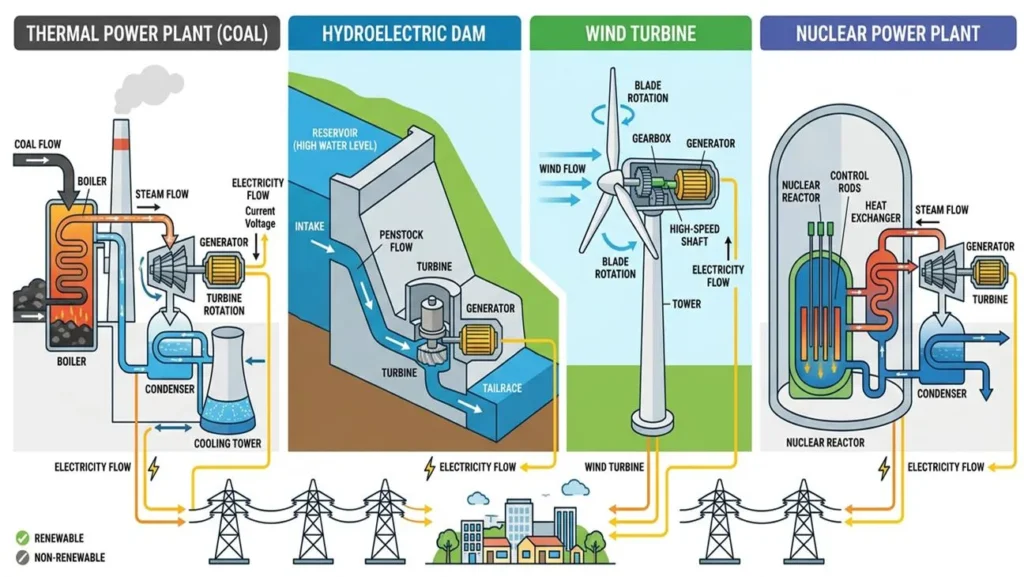
▸ Thermal Power Plant — Process Flow & Key Components
Rankine Cycle — Core Thermodynamics
Thermal plants operate on the Rankine Cycle. Water is heated to steam under high pressure, expanded through turbine stages, condensed back to water, and pumped back to the boiler — a continuous closed loop.
Above critical point (374°C, 221 bar), water transitions directly to steam without boiling — supercritical (SC) plants achieve ~43% vs ~35% efficiency of older subcritical plants.
Output: 300 MW – 3 GW typical
Flame temp: ~1400°C in furnace
Emissions: 820 gCO₂/kWh (highest)
Example: Mundra UMPP, India (4620 MW)
⚙ FGD, ESP required for emissions control
Combined Cycle: up to 62% efficiency
Gas turbine + steam recovery (HRSG)
Emissions: ~400 gCO₂/kWh (half of coal)
Example: Surgutskaya, Russia (5597 MW)
⚙ Fast ramp-up — ideal grid support
Output: 50 MW – 1.5 GW typical
High fuel cost — often backup only
Emissions: ~650 gCO₂/kWh
Common in oil-rich Middle East nations
⚙ Declining use globally post-2010
▸ T-s Diagram — Rankine Cycle
Pros
High reliability
Base load capable
Mature tech
Large capacity
Cons
High CO₂
Fuel cost risk
Water intensive
Low efficiency
Key Systems
Coal handling
Flue gas (FGD)
Ash handling
Cooling tower
Module 02
Hydroelectric Power
HYDRO · DAM / RUN-OF-RIVER / PUMPED STORAGE
Hydroelectric Generation
Potential Energy → Kinetic → Mechanical → Electrical
Efficiency
85–95%
World Largest
Three Gorges: 22.5 GW
Flow Equation
P = ρ·g·H·Q·η
Turbine Types
Pelton, Francis, Kaplan
Head Range
2m – 1800m
CO₂
~4 gCO₂/kWh
▸ Hydroelectric Dam — Cross-Section & Generation System
Turbine Selection Guide
Pelton (Impulse)Head: 300–1800m
Francis (Reaction)Head: 30–700m
Kaplan (Axial)Head: 2–80m
P = ρ · g · H · Q · η
P = Power (W), ρ = 1000 kg/m³
g = 9.81 m/s², H = net head (m)
Q = flow rate (m³/s), η = efficiency
Pumped Storage Hydro (PSH)
Works as a giant battery — pumps water uphill during low demand (off-peak), releases it to generate power during peak. Efficiency ~70–85%. Global capacity: ~160 GW.
▸ Wind Turbine — Internal Components & Electrical System
Betz Law & Power Equation
P = ½ · ρ · A · v³ · Cp
A = π·r² (swept area)
Cp_max = 16/27 ≈ 0.593 (Betz)
v = wind speed (m/s)
ρ = 1.225 kg/m³ (air at sea level)
Power scales with the CUBE of wind speed — doubling wind speed increases power 8×. This is why offshore sites with consistent, strong winds are so valuable.
▸ Wind Turbine Power Curve
DFIG vs PMSG Generators
DFIG (Doubly Fed Induction Generator) uses partial-scale converter — cheaper but requires gearbox. PMSG (Permanent Magnet Synchronous) is direct-drive — more reliable, lower maintenance, higher efficiency.
Pressurized Water Reactor — Most common globally (~70%). Uses two isolated loops: primary (pressurized water, ~155 bar, 325°C) never boils; secondary loop makes steam for turbine.
Units worldwide: ~300+
Example: Barakah NPP, UAE (5.6 GW)
Highest safety record of all types
Boiling Water Reactor — Simpler single loop: water boils directly in reactor vessel, steam goes straight to turbine. Cheaper but radioactive steam contacts turbine.
Units worldwide: ~70
Example: Fukushima Daiichi (BWR, Japan)
Lower pressure (~75 bar) than PWR
Small Modular Reactor — Next-gen: under 300 MW, factory-built, passive safety. NuScale, Rolls-Royce SMR lead development. Ideal for remote communities.
Status: First units deploying 2026+
Output: 50–300 MW per module
Passive cooling — no pump needed
Pros
Near-zero CO₂
Highest cap. factor
Dense fuel
Cons
Radioactive waste
High capital cost
Long build time
Module 05
Comprehensive Comparison
Parameter
Thermal
Hydro
Wind
☢ Nuclear
Efficiency
33–46%
85–95%
35–45%
33–37%
Capacity Factor
70–85%
40–60%
25–45%
85–92%
CO₂ Emissions
650–820 g/kWh
4 g/kWh
7–15 g/kWh
12 g/kWh
Capital Cost
Low–Mid
Very High
Mid
Very High
Operating Cost
High (fuel)
Very Low
Low
Mid (fuel+ops)
Output Voltage
11–25 kV (gen) → 400 kV
6.6–13.8 kV → 220 kV
690V → 33 kV → 132 kV
15–25 kV → 400 kV
Frequency Response
Fast (CCGT)
Very Fast
Limited
Moderate
Land Use
Medium
Very Large
Medium (shared)
Small
Water Use
Very High
Source (reservoir)
Minimal
High (cooling)
Plant Life
25–40 years
50–100+ years
20–30 years
40–60+ years
Fuel Source
Coal / Gas / Oil
Water (gravity)
Wind (kinetic)
U-235 / MOX
Grid Role
Base/Peak load
Base/Storage
Variable/Peak
Base load
▸ Performance Radar — Key Metrics Comparison
Module 06
Current & Voltage Flow
▸ Power System — Generation to Consumer: Complete Electrical Path
THREE-PHASE AC WAVEFORM — 50 Hz
■ Phase A — Reference (0°)
■ Phase B — Lagging 120°
■ Phase C — Lagging 240°
V = V_peak · sin(ωt + φ)
VOLTAGE — KEY FORMULAS
V_rms = V_peak / √2
V_LL = √3 · V_LN (line-to-line)
P = √3 · V_LL · I_L · cosφ
Voltage Drop = I · (R·cosφ + X·sinφ)·L
High voltage transmission reduces I²R losses. A 10× increase in voltage → 100× reduction in resistive losses for the same power transfer.
CURRENT — KEY FORMULAS
I_rated = P / (√3 · V_LL · cosφ)
I_fault = V / Z_total (Ohm’s law)
I_magnetizing ≈ 0.5–5% of rated I
Skin depth: δ = √(2ρ/ωμ)
Current ratings determine conductor sizing. Ampacity depends on conductor material (Cu/Al), insulation temp, and ambient conditions per IEC/IEEE standards.
▸ Power Transformer — Electromagnetic Induction & Voltage Transformation
Module 07
Protection & Safety Systems
Why Protection Systems Matter
Power systems can experience faults (short circuits, overcurrents, ground faults) that generate enormous destructive energy within milliseconds. Protection systems must detect, isolate, and clear faults in 80–150ms to prevent equipment damage, fires, and blackouts. Every plant type has dedicated protection schemes.
Overcurrent Protection
Relays (IDMT/Instantaneous) detect excess current. Operates via time-current curves. Types: TOC (Time Overcurrent), IOC (Instantaneous). Standard: IEC 60255. ANSI #51/50.
Differential Protection
Compares currents at both ends — any imbalance indicates internal fault. Extremely fast (20ms). Used for generators, transformers, buses. ANSI #87G/87T.
Earth Fault Protection
Detects leakage current to ground. Sensitive residual current devices (RCD). Zero sequence current detection. Critical in distribution (ANSI #64, 51N).
Distance Protection
Measures impedance to fault point. 3 zone scheme (Z1: 80% line, Z2: 120%, Z3: backup). Used on transmission lines. ANSI #21. Responds in <30ms for Zone 1.
Generator Protection
Loss of excitation (#40), reverse power (#32), stator earth fault (#64G), rotor earth fault (#64F), under-frequency (#81), pole slipping (#78), loss of mains.
☢
Nuclear SCRAM System
Emergency shutdown — control rods drop into core under gravity in <3 seconds. ECCS (Emergency Core Cooling) activates for coolant loss. Multiple redundant safety trains (IEC 61513).
Circuit Breakers
SF₆ gas or vacuum CBs interrupt fault currents up to 63kA. Operating time: 2–3 cycles (40ms at 50Hz). Auto-reclosure for transient faults (79 relay). Rating: 11kV to 800kV.
Wind Turbine Protection
Over-speed mechanical brake + aerodynamic brake (pitch control feathering to 90°). LVRT (Low Voltage Ride Through) for grid faults. Vibration sensors, ice detection, lightning protection.
Thermal Protection
Overflux (#24), transformer thermal image (#49), winding temperature. Buchholz relay in oil transformers detects gas from arcing. Pressure relief valves on boilers (ANSI #63).
▸ Protection System Operation — Fault Detection to Isolation
Key Considerations
Grid Stability & Frequency
Grid frequency (50/60 Hz) must be maintained ±0.5 Hz. Thermal/hydro/nuclear provide inertia. Under-frequency load shedding (UFLS) and automatic generation control (AGC) maintain balance. Wind/solar reduce system inertia — synthetic inertia via grid-forming inverters is increasingly required.
Environmental Considerations
Thermal: FGD for SOx, SCR for NOx, ESP for particulate. Hydro: minimum ecological flow, fish passage, sediment management. Wind: bird/bat collision, noise (45 dB limit at 500m), shadow flicker. Nuclear: spent fuel storage (dry cask, geological repository), tritium management.
Grid Integration Challenges
Variable renewables require: Battery Energy Storage Systems (BESS), pumped hydro, demand response, and smart grid technology. Power electronics (VSC-HVDC) enable long-distance transmission and offshore wind integration. Grid codes (P.O.12.3, ENTSO-E) mandate LVRT, reactive power support, and frequency response from all generators.
References
Sources & Further Reading
Textbooks
Power System Analysis — Stevenson & Grainger
McGraw-Hill | Fundamental power systems textbook covering load flow, fault analysis, protection, and stability.
TEXTBOOK
Power Plant Engineering — Black & Veatch
Chapman & Hall | Comprehensive coverage of all thermal power plant types, steam cycles, and efficiency.
For More depth study, explore: MIT OpenCourseWare (6.061 Power Systems), NPTEL courses on Power Systems Engineering, EDX courses from TU Delft on Wind Energy, and the World Nuclear Association’s technical reports on advanced reactor designs.