
⚡ POWER SYSTEMS ENGINEERING
Advanced EEE Technical Reference
Comprehensive coverage of generation, transmission, distribution, monitoring, protection systems and workforce safety
⚙️ POWER GENERATION FUNDAMENTALS
Understood How to the Power Generation Plant, Long-Distance Overhead HVDC Transmission, Power System Safety and Protection, Condition Monitoring, and Electrical Maintenance
Generator Operating Parameters
Three-Phase AC Generator: Synchronous generators convert mechanical energy into three-phase electrical power at 50 Hz or 60 Hz standard frequencies. Fundamental relationship: P = √3 × V × I × cos(φ)
Power Station Types & Characteristics
🔥 Thermal (Coal/Gas)
- Capacity: 100-500 MW per unit
- Efficiency: 38-42%
- Response: 5-10 minutes ramping
- Startup: 2-4 hours cold start
- Advantage: Baseload power, fuel diversity
💧 Hydroelectric
- Capacity: 50-1000+ MW per unit
- Efficiency: 85-90%
- Response: Seconds (fastest)
- Startup: 1-2 minutes
- Advantage: Storage, fast response
⚛️ Nuclear
- Capacity: 500-1500 MW per unit
- Efficiency: 33-36%
- Response: 30+ minutes (slow)
- Uptime: 90%+ availability
- Advantage: No emissions, high reliability
☀️ Solar PV
- Capacity: 1-100+ MW installations
- Efficiency: 15-22%
- Peak Hours: 5-6 hours daily average
- Limitation: Weather dependent, intermittent
- Advantage: No fuel, minimal maintenance
💨 Wind
- Capacity: 2-15 MW per turbine
- Efficiency: 35-45% of wind power
- Capacity Factor: 25-40% typical
- Limitation: Wind dependent, noise
- Advantage: Renewable, scalable
🔋 Battery Storage
- Capacity: 1-200+ MW storage
- Duration: 1-8 hours discharge
- Response: Instantaneous
- Use: Grid stability, peak shaving
- Advantage: Frequency support, fast response
Generator Monitoring Systems
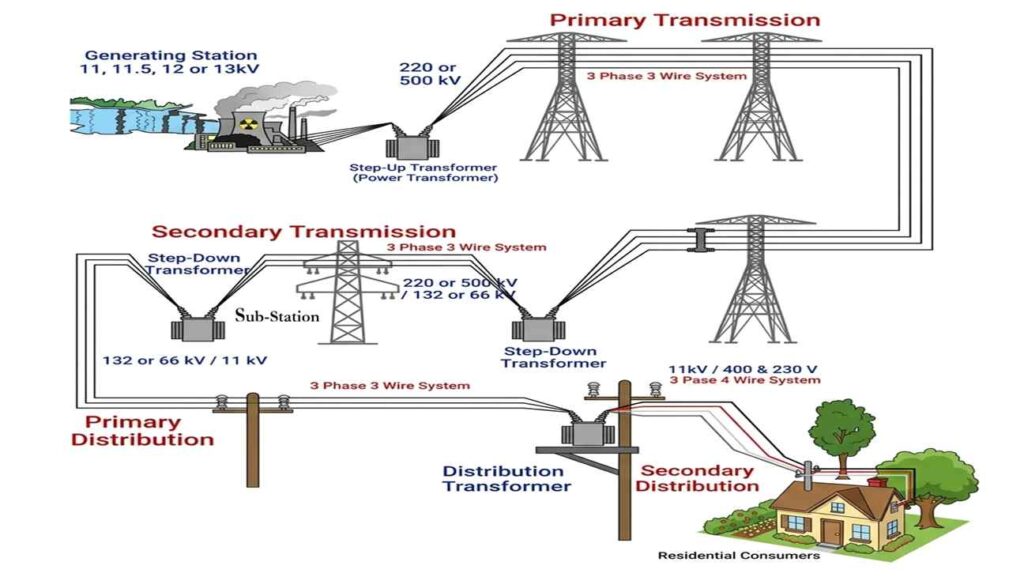
🔌 POWER TRANSMISSION SYSTEMS
High-voltage long-distance power delivery infrastructure
Overhead Transmission & Distribution~V
Key Principle: Transmission losses inversely proportional to voltage squared: Loss ∝ (Power² × R) / Voltage²
Example: 500 MW transmission at 100 kV = 42 MW loss (8.4%) vs 765 kV = 0.7 MW loss (0.14%)
Result: 765 kV reduces losses by 98%!
Example: 500 MW transmission at 100 kV = 42 MW loss (8.4%) vs 765 kV = 0.7 MW loss (0.14%)
Result: 765 kV reduces losses by 98%!
| Voltage | Classification | Distance | Application | Loss % |
|---|---|---|---|---|
| 765 kV | Extra High (EHV) | 200-500 km | National grid backbone | 2-4% |
| 500 kV | Extra High (EHV) | 150-300 km | Inter-state transmission | 3-5% |
| 345 kV | High (HV) | 100-250 km | Regional corridors | 4-6% |
| 220 kV | High (HV) | 80-200 km | Sub-transmission | 5-8% |
| 33-132 kV | Medium (MV) | 30-150 km | Distribution substations | 8-15% |
Main components Transmission Line
🔩 Towers
- Self-supporting lattice steel
- Heights: 30-150 m
- Spacing: 250-500 m
- Galvanized, 50+ year life
🔌 Conductors
- ACSR or AAAC aluminum alloy
- Size: 70-400 mm² cross-section
- Bundled: 2-4 sub-conductors
- Sag: 5-15 meters typical
⚡ Insulation
- Porcelain/composite suspension
- Clearance: 8-20 m ground minimum
- BIL: 1200-2500 kV rating
- Creepage: 31 mm/kV
🛡️ Lightning Protection
- Double overhead earth wires
- Tower grounding: <10 ohms
- Surge arresters at substations
- Back-flashover: <5%
🌡️ Thermal Rating
- Continuous: 50°C ambient
- Emergency: 100°C (<30 min)
- Real-time thermal rating systems
- Wind/weather ±15% variation
🔄 Reactive Power
- Series capacitors: 50-400 MVAR
- Shunt reactors: 10-100 MVAR
- SVCs & STATCOMs: Adjustable
- Voltage control: ±5% tolerance
Example OF Current Flow : 500 MW Transmission
📦 CONSUMER POWER DISTRIBUTION SYSTEMS
Final stage delivery to end consumers with voltage regulation by Power Agency
Distribution Network Topologies
🔄 Radial Distribution
- Single path from source
- Reliability: 85-92%
- Voltage drop: Increases with distance
- Cost: Lowest
- Use: Rural, suburban
🔀 Ring Distribution
- Circular loop, one point open
- Reliability: 95-98%
- Voltage: More balanced
- Cost: Moderate
- Use: Urban areas
🕸️ Mesh Distribution
- Multiple interconnected paths
- Reliability: 99.5%+
- Voltage: Optimally balanced
- Cost: Highest
- Use: Critical urban systems
Distribution Transformer Specifications
| Parameter | Small (1-10 MVA) | Medium (10-50 MVA) | Large (50-200 MVA) |
|---|---|---|---|
| Primary Voltage | 33/22 kV | 132/110 kV | 220/400 kV |
| Cooling Type | ONAN | ONAN/ONAF | OFAF/OFWF |
| Load Loss | 50-100 kW | 200-400 kW | 800-1500 kW |
| Efficiency | 98.5-99.0% | 98.7-99.1% | 98.8-99.2% |
| Insulation Class | Class F (155°C) | Class F/H (180°C) | Class H/C (200°C) |
| Lifespan | 25-30 years | 30-40 years | 40-50+ years |
Consumer Load Categories
👥 Residential
- Load: 2-10 kW per connection
- Voltage: 230 V single-phase / 400 V 3-phase
- Load Factor: 20-30%
- PF: 0.85-0.95
- Peak: Evening hours
- Share: 30-40% of feeders
🏢 Commercial
- Load: 50-500 kW per connection
- Voltage: 400/230 V 3-phase
- Load Factor: 40-60%
- PF: 0.90-0.98
- Peak: Office hours
- Share: 25-35% of feeders
🏭 Industrial
- Load: 500 kW – 50 MW per connection
- Voltage: 33 kV / 11 kV / 400 V
- Load Factor: 60-85%
- PF: 0.75-0.90
- Profile: Relatively constant
- Share: 35-45% of feeders
🌱 Agricultural
- Load: 5-100 kW per connection
- Voltage: 230 V single-phase / 400 V
- Load Factor: 30-50%
- PF: 0.80-0.95
- Peak: Seasonal, irrigation
- Share: 10-15% of feeders
🔧 MAINTENANCE & CONDITION MONITORING
Predictive and preventive strategies for power equipment reliability
Maintenance Strategy Types
⏰ Preventive Maintenance
- Scheduled at fixed intervals
- Time-based: Daily/Weekly/Monthly
- Reduces failures 40-60%
- Cost: Moderate, predictable
- Best for: Pumps, drives, fans
📊 Predictive Maintenance
- Scheduled by condition indicators
- Monitors: Vibration, temperature, oil
- 6-12 months early warning
- Reduces failures 35-45%
- Best for: Rotating equipment, transformers
Generator Maintenance Schedule
DAILY: Oil levels, temperature, vibration, coolant flow, electrical parameters
WEEKLY: Oil samples, bearing lubrication, thermography, IR testing, stator winding tests
MONTHLY: Full vibration analysis (FFT), air gap measurement, brush condition, coolant analysis
QUARTERLY: Partial discharge test, saturation curve, bearing clearance check, rotor flux testing
SEMI-ANNUAL: Major teardown – bearing inspection, stator slot cleaning, exciter overhaul
ANNUAL: Stator coil assessment, rotor bar testing, bearing replacement, seal kit renewal
3-5 YEARS: Complete rotor & stator replacement, shaft crack detection, core lamination check
Transformer Condition Assessment
⚗️ Oil Analysis (DGA)
- Dissolved gas analysis indicates fault type
- H₂: Electrical discharge
- CH₄: Thermal fault >150°C
- C₂H₂: High-temperature arcing
- Quarterly (critical), annually (normal)
💧 Oil Quality
- Moisture: <50 ppm target <20 ppm
- Acid Number (TAN): <0.3 mg KOH/g new
- Viscosity: ±10% of original
- Particle Count: ISO 16/14/11 target
- Flash Point: >150°C minimum
⚡ Insulation Tests
- Power Factor: <1% new, alert >3%
- Tan Delta: <0.5% target, >2% action
- Insulation Resistance: >100 MΩ
- High-Pot Test: 1.5× rated 1 min
- Capacitance: ±5% of nameplate
🔬 Advanced Diagnostics
- Partial Discharge (PD): <5 pC level
- Frequency Response (FRA): Winding deformation
- Thermal Imaging: Detect hotspots
- Ultrasonic: Core integrity, lamination
- Saturation Curve: Magnetization assessment
Condition Monitoring Techniques Specific
📊 Vibration Analysis
- 0-10 kHz bandwidth
- FFT analysis for frequency content
- Detects: Bearing defects, imbalance
- Standards: ISO 10816, ISO 20816
- RUL: 6-12 months after detection
🌡️ Thermal Monitoring
- Infrared cameras: ±2°C accuracy
- RTD sensors: 0.5°C resolution
- Detects: Blockages, degradation
- Threshold: >10°C unexplained rise
- Action: Investigate immediately
⚡ Electrical Signature (ESA)
- Non-invasive current/voltage measurement
- Detects: Rotor bars, air gaps, shorts
- 6+ months early warning
- 95%+ fault detection rate
- Portable field instrument
🎚️ Ultrasonic Testing
- Partial discharge & corona detection
- Bearing lubrication assessment
- Friction analysis
- 20-100 kHz frequency range
- Real-time detection capability
🔬 Oil & Coolant Sampling
- Monthly baseline trending
- DGA critical for transformers
- Particle count ISO 4406
- Chemical tests: TAN, water, viscosity
- Early fault indicator: Gas ratios
📡 Real-Time Monitoring
- 24/7 continuous acquisition
- Cloud-based AI/ML analytics
- Automated alarming
- Predictive RUL forecasting
- ROI: 3-5 years (reduced downtime)
🛡️ PROTECTION & SAFETY SYSTEMS
Equipment and personnel protection with comprehensive Standard safety procedures
Protective Relay Functions (ANSI Codes)
| Function | ANSI Code | Condition Detected | Setpoint | Trip Time |
|---|---|---|---|---|
| Overcurrent | 50/51 | Fault/Overload current | 150-300% I_rated | Instantaneous – Inverse |
| Over-voltage | 59 | Voltage > 110-120% | 1.1-1.2 V_n | 0.1-5 seconds |
| Under-voltage | 27 | Voltage < 70-90% | 0.7-0.9 V_n | 0.5-10 seconds |
| Differential | 87 | Internal equipment fault | 10-30% pickup | Instantaneous |
| Distance (Line) | 21 | Line impedance fault | Zone 1-3: 80%-150% | Stepped 0-0.6s |
| Reverse Power | 32 | Power flow reversal | 5-10% rated | 1-5 seconds |
| Under-frequency | 81R | Generation loss / blackout | 49-49.5 Hz | 50-100ms (staged) |
Global Electrical Safety Standards
📋 Arc Flash Hazard
- IEEE 1584-2018 standard
- Incident energy cal/cm²
- PPE Category 0-4+
- Update every 5 years
- Boundary posting required
🔒 LOTO Procedures
- OSHA 1910.147 standard
- Identify → Isolate → Lockout → Tag → Test
- Energy isolation schedule
- Annual training certification
- Monthly compliance audits
⚠️ Working at Height
- Harness required >6 feet
- Certified rescue equipment
- Rescue team pre-identified
- Constant communication required
- Quarterly safety drills
🧯 Fire Prevention
- Class C (electrical) suppression
- CO₂, FM-200, dry powder systems
- Fire-rated cable trays
- Oil containment 110% capacity
- Monthly detection testing
Black Start Emergency Procedure
System-Wide Blackout Recovery Timeline:
T = 0 min: Outage detected, under-frequency relays begin activation
T = 5 min: Load shedding at 49.5 Hz, frequency still falling
T = 10 min: Critical loads disconnected, hydro units prepared
T = 15 min: First generator synchronized at 48.5 Hz, voltage 20-40% nominal
T = 30 min: Multiple units online, frequency rising, voltage restoration underway
T = 60 min: System stabilized 49.8-50.2 Hz, base load restored
T = 120 min: Load restoration sequence begins (critical → industrial → residential)
T = 240 min: Full normal operation restored
Success Requirements: Designated black-start units, strategic load shedding (30-50%), reactive power support devices, trained operators, independent communication systems
Worker Welfare & Safety Programs
👨⚕️ Health & Wellness
- Annual medical screening
- Occupational health assessments
- Hearing protection programs
- Mental health support services
- Fatigue management protocols
📚 Training & Development
- Initial safety induction
- Equipment operation training
- Annual refresher courses
- Emergency response drills
- Career development pathways
🎯 Incident Management
- Near-miss reporting systems
- Accident investigation procedures
- Root cause analysis (RCA)
- Corrective action tracking
- Safety performance metrics
🤝 Workplace Culture
- Safety incentive programs
- Peer feedback systems
- Leadership commitment visible
- Inclusive safety committees
- Worker recognition programs
✨ SIMMARY AND KEY HIGHLIGHTS
Fundamental concepts for modern power system engineering
⚡ Generation
- P = √3 × V × I × cos(φ) watts
- 50/60 Hz synchronous standard
- Frequency ±0.5 Hz via governor
- Voltage ±5% via AVR regulation
- PF optimization target >0.95
🔌 Transmission
- Higher voltage: Exponential loss reduction
- 765 kV minimizes long-distance losses
- Double/triple circuits maximize capacity
- FACTS devices for voltage control
- Sub-cycle fault clearing (<100 ms)
📦 Distribution
- Radial/ring/mesh trade cost-reliability
- Step-down transforms enable efficient delivery
- Voltage regulation ±10% at consumer
- 25-50 year transformer lifespan
- Automated sectionalizing reduces outages
🔧 Maintenance
- Predictive: 6-12 month RUL detection
- Oil DGA critical for transformers
- Vibration trends detect degradation
- 30-40% cost reduction via condition-based
- AI-driven optimization emerging
🛡️ Protection
- Multi-layer relay protection
- Millisecond fault isolation
- Arc flash hazard analysis required
- LOTO prevents catastrophic incidents
- Black-start ensures resilience
🌍 Future
- Renewable integration challenges
- Battery storage for stabilization
- Microgrids & distributed generation
- Cybersecurity for digital systems
- Carbon-neutral electrification goals
Power Systems Engineering: Delivering reliable electrical energy to billions of people—365 days a year, around the clock (24/7)—to meet growing demands in a safe and sustainable manner, utilizing fundamental physics, rigorous engineering methodologies, and continuous innovation.